New resources for mind maps, graphic organizers, and learning

After School Care Programs
I got a nice email yesterday from Veronica Taylor of After School Care Programs in El Paso County, Colorado. She wrote:

With school resuming, I’ve been putting together educational resources to help the kiddos. I’m always looking for new educational sites, and yours has been a big help! Thank you!

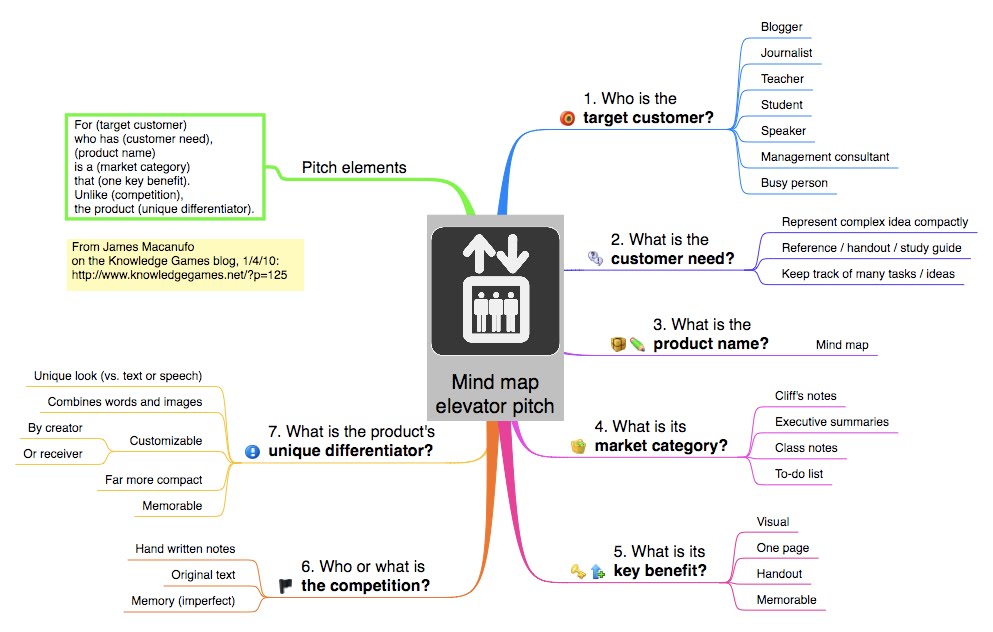
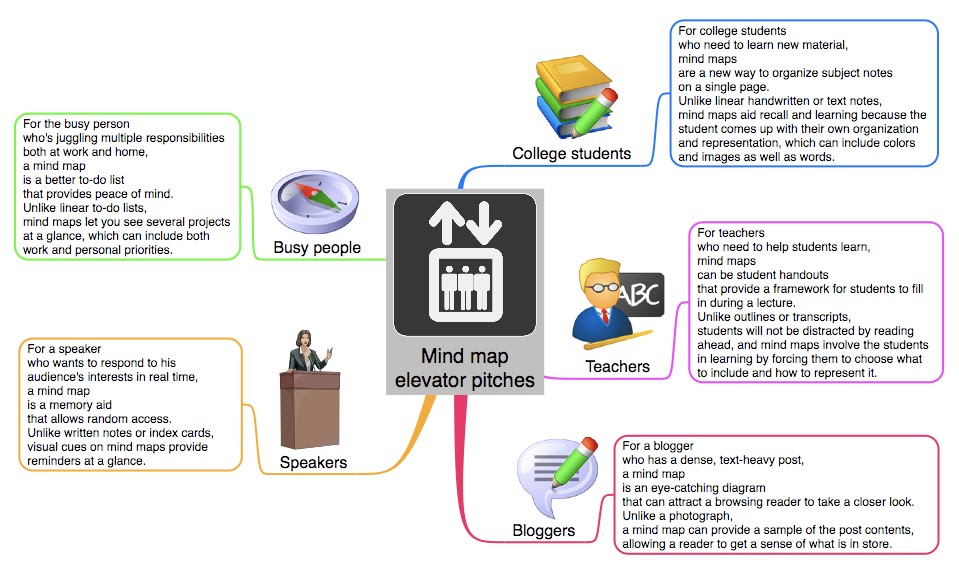
The summer volunteers have been involved as well, I’m letting them pick some of their favorite resources to include. Here’s one that I loved, too! It might be a good fit for your page…lots of info on various graphic organizers: Fostering Better Business Communication – Mind Maps & Graphic Organizers

I hope you like it!  Could you include it on your page with the other resources? I’d love to show our summer helpers that their work hasn’t gone unnoticed.

I appreciated her note very much, and I’ve added the link to my mind map page and graphic organizer page. It has 40 links to informational pages on mind maps and graphic organizers. Update, May 2, 2016: The latest version of the page is here, with fewer links – I suppose some of the original ones have disappeared.
Headline

Veronica’s organization’s website has a wealth of educational resources, too, which inspired this blog post so I could highlight it. Subject areas include Language Arts, Math, Science, Social Studies, and Health & Nutrition, each with 40 or 50 links. There’s no excuse for boredom or ignorance with a resource like this! Thank you, Veronica!

The fox and the hummingbird: new thinking from Dan Roam

There’s no VizThink conference this year, but a lot of the visual thinking crowd is at SxSW in Austin, Texas, right now, and I’ve been “virtually there” by following their tweets (status updates) on Twitter. Dan Roam spoke there today, and some of the comments about his talk, “Blah Blah Blah: Why Words Won’t Work” were:

  • One of the smartest guys I’ve heard speak.
  • This is probably the best presentation I’ve ever seen. Ever.
  • Hands down best preso I’ve attended so far.
  • He could be the smartest guy on the planet.
Interesting that a great speaker and presenter used a lot of visuals and was perceived to be very smart! Could it be that he’s onto something?
A lot of tweets repeated concepts that were familiar to me from his two excellent books, The Back of the Napkin and Unfolding the Napkin, but I was intrigued by some new ideas.
More and more people are familiar with the concept of left brain and right brain, and their different strengths. He’s got an updated version of that concept for distinguishing between our verbal mind and our visual mind. He likens the verbal mind to a fox – clever, linear, analyzing – and the visual mind to a hummingbird – spatial, spontaneous, and synthesizing.
I don’t know much about foxes or hummingbirds, but it will be interesting to see how he uses and develops this idea. Here’s a short YouTube video of each:

Another new mnemonic he introduced was “ViVID” thinking: Visual-Verbal Inter-Dependent thinking. Despite the title of his talk, Why Words Won’t Work, he’s not against words; he thinks we need to use both words and pictures in order to thoroughly explore and share ideas. “ViVID” encapsulates that idea brilliantly. There was even a suggestion that he’s working on a new book, to be titled Vivid Thinking.
Check out the original tweets by searching Twitter for the hashtag #whywordswontwork .
Dan is a great voice for visual thinking, and, thanks in large part to him, the business world and wider public are starting to wake up to its value. I’ll be watching Dan’s blog, and any other public appearances, for more.

Getting linear

When you’re excited about something, you want to share that excitement with other people. But sometimes that comes across as “this is so great, you’ve got to try it!” which isn’t very compelling. Just because you’re excited about it, doesn’t mean that they will be.

I’ve had a hard time communicating why I think mind maps (and other visual tools) are so great. I just found something that helps me do that on the Knowledge Games blog. James Macanufo outlines a process for crafting a product elevator pitch. As he says, “The better and bigger the idea, the harder the pitch is to write.” This is just what I have been struggling with, so I decided to experiment with it, and found it worked really well for me.

Here’s what I learned as I worked through this process.

I tend to generalize, and see mind maps as a multipurpose tool that can be very helpful for almost anyone in many situations. This has made it hard for me to verbalize concrete descriptions of their benefits. This exercise helped me to focus on one beneficiary at a time and be specific about how they could benefit. I needed a tool like this to help me be more linear.

When I got down to crafting a single elevator pitch, I found that I thought of new and more specific ideas, that were more applicable, than the ones I’d initially brainstormed for each field.

I haven’t word-smithed these yet, or tested my results on friends or potential customers. But I feel I have something more concrete, that I will be able to communicate more succinctly, than I have had in the past. This increases my confidence and comfort level.

This came at a good time for me, and I plan to do the same exercise for some other products and services.

New ways of seeing

Storyline threads

My husband has sometimes wished for a way to track characters in a book as he’s reading. He often reads several books at a time, so progress through one is slow, and it’s easy to lose track of events or who’s who. Today he came across an example of one way someone did that for several films (it should work equally well for books, I think). It traces intersecting story threads in a simple but effective way. We’ve both wondered whether authors use such devices for themselves when plotting a book.

Looking at the top map, for Lord of the Rings, the creators used different colors to represent hobbits, elves, men, and other creatures. Time flows from left to right, and important events and locations, such as Bilbo’s party and Isengard, are represented in different places on the map.

It’s interesting to compare maps of different stories, on the bottom row. The map of 12 Angry Men shows 12 parallel threads. Without seeing the movie, this is ambiguous, because it could be interpreted either as all interacting together the entire time, or having no interaction. (Adding context, such as an enclosing space labeled “Jury Room”, could help.) It looks like Primer would be confusing: Just three characters, whose lives intertwine messily, with no landmark places or times, and whose final fates are unclear! I suppose some lives feel like that at times. (I found out it’s about time travel, from this Wikipedia entry.) From xkcd, via Flowing Data.

Evolution of thinking

I have trouble, sometimes, committing myself to a conclusion, because I recognize that my understanding is always evolving as I get more information and consider more points of view. Many scientists and others seeking “truth” can probably relate. The evolution of one scientist’s thinking over the course of 13 years is traced in a visualization of changes in six editions of one of his books. With different colors representing each edition, if you let this play out, you see how words are added and removed, and, dramatically, how an entirely new chapter is added. I also discovered that if you hover your cursor over a section, you can read the words, in the color representing the edition in which they were added. The work traced is Charles Darwin‘s famous On the Origin of Species by Means of Natural Selection, first published in 1859, with the 6th edition published in 1872. From Ben Fry, from this CNN article, “A new way of looking at the world”, via Flowing Data.

Elephant Egg 5


I was one of 5 presenters at the latest Elephant Egg event on Oct. 22. This was the best one yet, in my opinion. None of the presenters used bullet points, or read us their slides! In fact, all used the medium in the way recent research says is most effective: the visual content on the slide and the presenters’ spoken comments complement and support each other.

Barking
“Dr. Kate” Kathleen Ireland, a science teacher at Seabury school, shared her experience of the trip of a lifetime, going to the Galapagos Islands with other teachers. She told us how excited she was when her application was accepted: she felt like Charlie, in Charlie and the Chocolate Factory, winning the golden ticket. She told us that all the animals, and even the people, bark, and used that as a metaphor for getting people’s attention to recycling and other ecological concerns.

Uncovering Pa`u
Linda Lindsay gave a graceful and dignified presentation about her current film project, a documentary about the pa`u riders – Hawaiian women who ride horses – and their traditions, a piece of Hawaiian culture that few are aware of. You can follow her work by becoming a fan of her Facebook page.

Visual Language

(Click to view a video of my presentation on YouTube. I’m mostly a silhouette in the shadows, but the presentation and audio are pretty clear.)

My presentation had an audacious goal: to teach the audience a new language! I provided a worksheet to make it an active learning experience and was pleased to see almost everyone participating. Having a table full of friends to support me made it so much easier to make my first public presentation – thanks for being there for me, Jeff, Jeff, Francine, Ann, and Don! And thanks to Gabe, who couldn’t be there, but suggested doing the video.

Here’s the presentation on Slideshare, if you’d like to review it or read through at your own pace.

Wander
Paul Wood, a writer and educator, did a multi-media performance piece accompanied by music by Duke Ellington, commenting poignantly on a current issue, the diversion and restoration of Maui stream water.

Maui forest birds
Mike Neal came to Maui years ago to surf, but has recently discovered a new passion in the cloud forests on the slopes above us, photographing and working to preserve native birds of Maui. These birds are extremely rare, with only a few hundred individuals (of some species) surviving in the world.


The presenters, from left to right: Kathleen Ireland, Mike Neal, Linda Lindsay, Paul Wood, Karen Bennett.

Thanks again to Maggie Sutrov and Ian Blakeslee for organizing this evening of inspiration! They are planning another event next month which promises to be fascinating: The Reverse Origami Film Festival, which will feature short (5 minutes or less) videos by Maui film makers, on Nov. 21.